Momentum Indicators (Relative Strength Index)
How do you measure the speed of stock prices? How do momentum indicators like the relative strength index help you spot trend reversals early.
What is a momentum indicator?
Momentum indicators are mathematical tools used by technical analysts to measure exactly how fast a stock's price is changing. When a stock starts moving in one direction, these tools help tell you if the trend is accelerating with strong power or if it is starting to run out of steam. Popular tools like the RSI (Relative Strength Index) assign the stock a score from 0 to 100, which visualizes the strength of the buyers compared to the sellers. This helps traders figure out if a price move has gone way too far and is due for a sudden reversal.
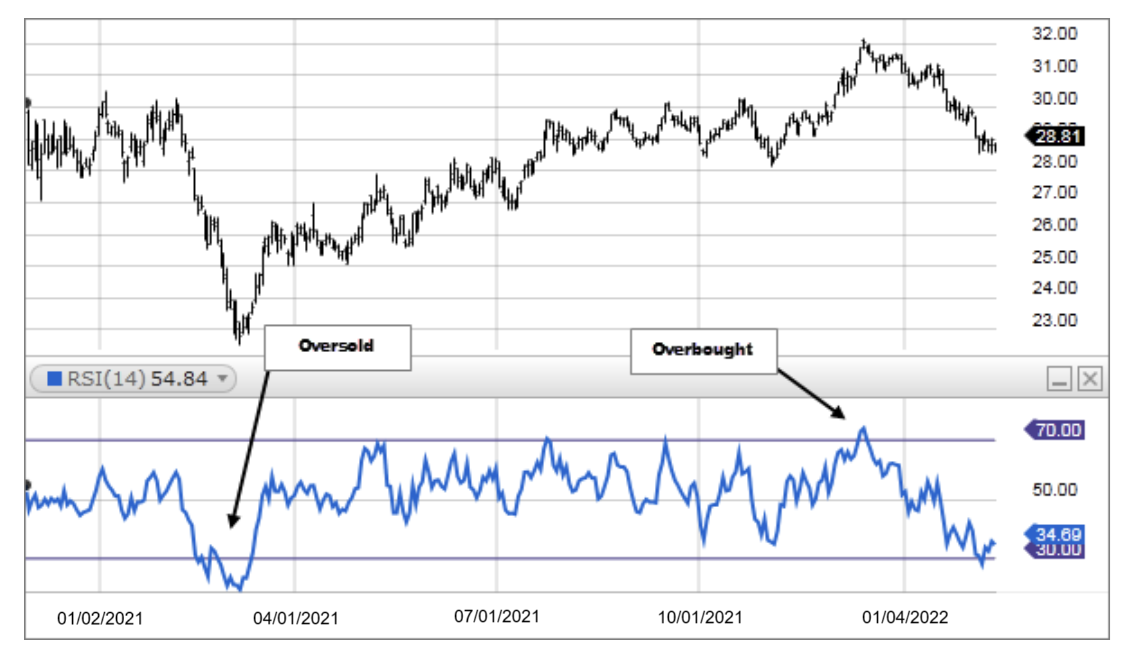
How do I use the Relative Strength Index (RSI)?
RSI has two lines, one at 70 and one at 30. If the RSI graph passes 70, then the stock is considered overbought. On the contrary if the graph drops below 30, then the stock is oversold.
A RSI considered "overbought" means that there are too many buyers. This could mean buyers have pushed the price up too fast, warning traders of a potential overevaluation of the stock that could lead to a reversal. If the score falls below 30 and is considered "oversold", it means there are too many panic sellers. They could have pushed the price down, presenting a possibility of the price bouncing back up.